Thursday

Final Exam Review

Cramming for tests, vs. learning the material:


The more times you use a neural pathway, the larger that pathway becomes, and the easier it is to use - ie - the more time you spend studying, the more practice problems you solve, the easier it gets, the better established your neural pathways become.

Exam Schedule:
http://www.lonestar.edu/examschedule.htm

Tuesday May 6
8:00 - 9:50 am

For the Upcoming Test & Team evaluation:
  • Come prepared (be there early, with pencil and calculator.  You will not be allowed to use the computers.)
  • Skim through entire test before starting
  • Do the easy problems first
  • keep track of the time
  • Go for partial credit - don't leave anything blank - if you know it's wrong, explain that you know it is wrong, and write down your thinking process.
  • Show all of your work.
  • Don't erase your work - just put a single line through it (you might get more partial credit)


  • Check over your answers, and re-check them. Don't leave early.

    Warning: To prevent cheating, each test will be slightly different, so don't copy what your neighbor is doing!   

Final Team Evaluation:

Finish this BEFORE coming to the test. 


~~~~~~~~~~~~~~~~~~~~~~~~~~~~~~~~~~~

Review:


~~~~~~~~~~~~~~~~~~~~~~~~~~~~~~~~~~~~~~~~~~~
~~~~~~~~~~~~~~~~~~~~~~

Intro to C++ : link

What is in your program?

#include "StdAfx.h"
#include "iostream"
#include instructs the pre-processor to include another file (the file SrdAfx.h, and iostream or in out stream in this case)

C++ has a library of many codes like "iostream" you can use to save yourself time & hassle.
http://www.cplusplus.com/reference/iostream/

iostream - input and output program, lets you use "cin" and "cout" to allow a user to imput data into the program, and for the program to output data back to the user.

StdAfx.h namespace, reduces compile & processing time
- http://www.cplusplus.com/articles/1TUq5Di1/


int main () 
the first function, where the program actually begins.

 
{} Surrounds the function
{ start
end}

int birthmonth,birthyear; - defining your variable types.
int = integer, tells it that "birthmonth" is going to be a whole number like "6" not "6.34915"
(Float = if you want to use something like 6.34915...)

if statements - if (x) then do (y)
    cout <<"Hello World"<<endl; Outputs "Hello World" to the user

;  C++ syntax, ends the command

    system("PAUSE");
or
getch(), Pauses the screen "press any key to continue"

    return 0; error check, if you get to the "0" it means the main function has executed and ended

 Commenting
// HW.cpp : Defines the entry point for the console application.

//


For the test - study the age calculator code - if I changed it, could you figure out what the code is doing?  what does it output? 
// Age Calc.cpp : Program to calculate someone's exact age.

//


#include "stdafx.h"

#include<iostream>

#include<conio.h>
using namespace std;
int main(int argc, _TCHAR* argv[])
{
       int birthmonth,birthyear;
       int currentmonth,currentyear;
       int agey,agem;
       cout << "\n\n\t\t\t Age Calculator\n\n";
       cout<<"Enter Your Birth Year(Eg:1989):";
       cin>>birthyear;
       cout<<"\n\nEnter Your Birth Month(Eg:7):";
       cin>>birthmonth;
       if(birthmonth > 12 || birthmonth < 1)
       return 1;
      
       cout<<"\nEnter The Current Month(Eg:7):";
       cin>>currentmonth;
       cout<<"\nEnter The Current Year(Eg:2010):";
       cin>>currentyear;
       agey=currentyear-birthyear;
       agem=12-birthmonth;
       cout<<"\n\n\t\tYour Age is "<<agey<<" Years And "<<agem<<" Months ";
       getch();
       return 0;
}

~~~~~~~~~~~~~~~~~~~~~~~~~~~~~~~~~~~~~~~~~~~~~~~~~~~~~~~~~

Mathematica - link

How to input data:

Function[square bracket, arguments separated with commas]
Sin[2.3]
Plus[2,2] = 2+2
Mean[{30, 34, 29, 15}]
Solve:
use "==" - two equal symbols
Solve[x^2-5x+6==0, x]  (shift + enter)
{{x-2}, {x-3}}

Solve[x^2+x+1==0, x]//N
//N - gives answer in numerical form
{{x-.5-.86i},{x-.5+.86i}}

Solve[a*x^2 + b*x + c==0, x]
x = quadratic formula

Solve system of equations - use {}
Solve[{3 x + 2 y ==15, 3*x - 3*y == 12}, {x, y}]//N

Graphing:

Points:
ListLinePlot[{{1,2}, {3, 4}, {5,3}}]


Plot[Sin[x]/x , {x, -9.4, 9.4}]

Plot3D[Sin[x*y], {x, -Sqrt[3*Pi], Sqrt[3*Pi]}, {y, -Sqrt[3*Pi], Sqrt[3*Pi]}]


*** Mathematica "help" resources -


help - documentation center- 10,000 pages of info on all the functions and examples and tutorials on how to use them


~~~~~~~~~~~~~~~~~~~~~~~~~~~~~~~~~~~~~~~~~~~~~~~~~~~~~~~~~~~

8 main parts of a computer - link

If I give you picts of the parts in a computer, can you tell me what it is, and what it does?


~~~~~~~~~~~~~~~~~~~~~~~~~~~~~~~~~~~~~~~~~~~~~~~

Engineering Ethics - link

Can you name an engineering disaster, and briefly discuss:

  • What happened
  • Why it happened
  • How it could have been prevented

Knowing "there can never be enough rules to anticipate and cover every situation, and even if there were, enforcement would be impossibly expensive and burdensome."

What is needed to uphold and maintain ethical practices?


Engineer’s Obligation to Society, to their employer, to clients, and to other engineers:
- only approve designs that safeguard life, health, welfare, and property of the public
- if an engineer’s professional judgment is overruled resulting in a safety concern, it is their responsibility to notify employers, clients, authority figures, the public, and all involved.
- Engineers should be objective, truthful, and unbiased. 
- Engineers should not express opinions in areas they are not qualified in,
- Engineers should not associate with anyone or anything that is unethical


~~~~~~~~~~~~~~~~~~~~~~~~~~~~~~~~~~~~~~~~~~~~~~~~~~~~~~

Dynamics

link 1
link 2
link 3


Given some variation of one of the three below graphs, could you figure out the general shape of the other two graphs? 


Think about the graphs & how they relate to one another.

position vs. time graph → velocity = slope = ds/dt = change in position / change in time

Velocity vs. time graph →position =  vel * time = (mph*hours = miles) = area under curve

Velocity vs. time graph → acceleration = dV/dt = change in velocity / change in time = slope of V-t line

Acceleration vs. time graph → adt = dv  (a = dv/dt)


~~~~~~~~~~~~~~~~~~~~~~~~~~~~~~~~~~~~~~~~~~~~~~~~~~~~~


Last questions on test, start thinking about your answer now!

What did you like most about 1201?
What can we do to improve 1201 in future semesters?


Email me / call me if you need help understanding or studying for any of it, I hope you've had fun!!


Tuesday

Ch 19, 20, 21, 22

So sorry to miss class this morning!! (I have a sick kid at home)  I will be in tonight from 6:00-9:00 if you need help, or you can call me (303) 842-4554.

Just for fun:


Project Presentations next week!!!

http://engr1201.blogspot.com/2014/03/engineering-project-report-presentation.html


Ch 19: The Campus Experience:


19.4 Ask lots of questions
Active questioners are the ones who learn the most.


Etiquette for asking lots of questions:

Explain your misunderstanding:


  • "I'm sorry, I think I misheard you..."
  • "I don't quite understand that explanation..."
  • "I'm sorry, I was distracted - can you say that again?"
    Explain what you understand:
  •   I understand _____ where I get confused is _____.
  • Be confident
    • It might not be your fault you don't get it, it might be their fault for not explaining it clearly enough - so don't feel bad that you are having to ask!
    Research as much as you can beforehand
    If you can't find an answer in class, use the internet! 
    .
    19.5 The People Issue
    Meeting people:
      Join the "I talk to Strangers" movement!


    Work in groups, know the email/phone/names of 3-4 other people in each of your classes.


    Networking:Think about all of the different jobs you have had so far, how may of them were a result of knowing someone who worked there?

    Jobs often come through people you know.


    Adviser:
    Find an adviser that is in your department, who understands the requirements for your degree. 


    Shelley.Caraway@lonestar.edu


    Before you register, go over your schedule with Shelley to make sure you are not taking classes you don't need, or that you are not missing anything.


    Investigating Instructors:
    http://www.ratemyprofessors.com/
    You don't always have a choice, but if you do, might as well choose wisely!


    Know and use your Campus Resources:
    Events Calendar: link

    Financial Aid: link

    Career Services: link
    Career Fairs: link

    Tutoring: link

    Library hours: link

    Fitness Center: link

    Food: link


    Can you name all of the buildings on your campus? 
    Take the campus tour - link


    Time management:
    "If you haven't got the time to do it right, when will you have the time to do it over?" - Jeffrey Mayer


    It's worth it to read your book!

    1st preview it:

    • take 30 seconds to look over titles and headings. 
    • look at any pictures, charts, examples. 
    • Get general idea of the main idea

    Use your eyes & brain, don't talk to yourself!  Hooked on Phoenix taught us all to talk to ourselves when we read, but talking is slow, you can read faster if you don't say it in your head to yourself. 

    Read in phrases, rather than individual words. 

    Skim through & read easy material quickly, slow down for harder material.  If your reading speed is right, you should not have to re-read anything to make sense of it.

    Highlight key sentences & ideas.

    Check out some of the speed reading apps:
    http://www.spreeder.com/


    Fulfilling Duties:
    Take pride in being part of academia, 
    Get involved,  you get out of things what you put into them.


    Use the Web!

    Use wiki, youtube, Forums, email your instructors.

    Learn how to type:
    http://www.typingweb.com/


    Study, Take notes,

    Stress management -
    Balance & moderation in all things.
    Find people to vent to.

    http://www.listeningear.com/

    If you don't know anyone you feel comfortable venting to, just get online somewhere to vent.


    Chapter 20: Financial Aid


    Financial Aid: link

    There are several types of financial aid available: link


    http://www.youtube.com/watch?v=r98yqbkcn6U


    How many of you have a summer job lined up?

    How many of you have family / friends who know of job openings?

    How many of you need a letter of recommendation? 

    If you put a lot of effort and work into your semester project, and get all of your HW turned in, I will write you up a letter.  You can also write up letters for one another - swap letters with the people in your project team, exchange info.  You can also use me (and hopefully your team mates) as a reference.


    Chapter 22: Liberal Arts and Engineering


    I posted the new course requirements:
    http://engr1201.blogspot.com/2014/04/engr-info.html

    What's up with the HIST, GOVT, and ENGL requirements you might ask?  ....


    Aren't liberal arts classes the joke classes for people who aren't smart enough to do math??? Why do we have to take these classes again????   ...


    Take a second to remember:
    What is the point of engineering?
       A - To make the world a better place for everyone.

    What do you need to know in order to better serve others?
      A - you need to understand people, society, government, history.

    ENGL Composition classes???
       This is the information age, you need to know how to create & communicate information.  The age of technology is a result of the age of information, we have advanced as far as we have because of our increased ability to learn and communicate with one another.

    Take your lib arts classes seriously, they are not a joke!!!


    Chapter 3: Profiles of Engineers pg. 73

    1 pg long bios of engineers talking about their job & life - worth reading!!!!

    Next week -
    Project Presentations, Final review, turn in mousetrap car graphs.

    Need help?  Come by ENGR1304, in this room, Tu/Th 9:30-12:30, 6:00-9:00 at night.


    Just a couple more weeks!!!!
    You're almost there!!!!


    Professional registration and licensure


    • ¨Professional registration and licensure earns you the title of Professional Engineer (PE) 
    • ¨For most engineers, professional registration is optional
    • ¨About 20% of all practicing engineers are registered (Civil engineers have a higher rate of registration)
    • ¨For fields of work that involve public safety, professional registration may be mandatory¨
    • ¨Professional registration is handled at the state level
    • ¨Requirements are almost uniform across states due to the efforts of the National Council of Examiners for Engineers and Surveyors (NCEES)
    • ¨More information is available at http://www.ncees.org , where they have links to each states’ contact information regarding professional registration

      State licensing boards:
      http://ncees.org/licensing-boards/


    • ¨For Texas, information for professional registrations can be found at the Texas Board of Professional Engineers’ website:  http://engineers.texas.gov
    • ¨The requirements for professional registration in Texas are:
    • ¤Obtain an ABET (Accreditation Board for Engineering and Technology) accredited engineering degree
    • ¤Pass the NCEES Fundamentals of Engineering (FE) exam
    • ¤Obtain four years of engineering practice and get three references from currently licensed PE’s 
    • ¤Pass the NCEES Principles and Practice of Engineering Exam (PE) and the Texas Ethics of Engineering exam
    • ¨There are some variations to the process regarding graduate degrees

    ¨Fundamentals of Engineering Exam
    • ¤Offered every year in April and October
    • ¤8 hour closed book exam – Morning Session 120 M/C Questions (General), Afternoon Session 60 M/C Questions (Discipline Specific)
    • ¤Test locations: Fort Worth, Austin, El Paso, Houston
    • ¤Student Sites: Texas Tech, Texas A&M, West Texas A&M, UTEP, Texas A&M Kingsville, UTSA, University of Texas Pan Am, LeTourneau University
    • ¤After passing FE (Fundamentals of Engineering) exam and obtaining degree, you can apply with the state to be an Engineer-In-Training (EIT)
    • ¤Recommendations: prep course, take exam senior year 

      Principles and Practice of Engineering Exam

    • ¤Offered every year in April and October
    • ¤8 hour discipline specific closed book exam – M/C and Essay questions
    • ¤Test locations: Fort Worth, Austin, El Paso, Houston
    ¨Texas Ethics of Engineering Exam

    • ¤Can be taken online
    • ¤Open book

      Additional certifications:


    Wednesday

    Excel Formatting / Tutorial

    Don't forget - SME today!

    https://blogger.googleusercontent.com/img/b/R29vZ2xl/AVvXsEhUnPJyja3tLlOYYq9-2NZnSSqIy4QQEVs7x7vDEmHJ27re_XrdsfcJ65CuO_uelbYvXPh_rwuph7Sejy0vmerTZmjeSqY3SWh3h2DVbPZ-iRzV6zwPna2mKf_ZatvsvO59dXHtG3l_Qas/s1600/SME.JPG


    - Correct Formatting for Tables, Graphs & Calculations in Excel

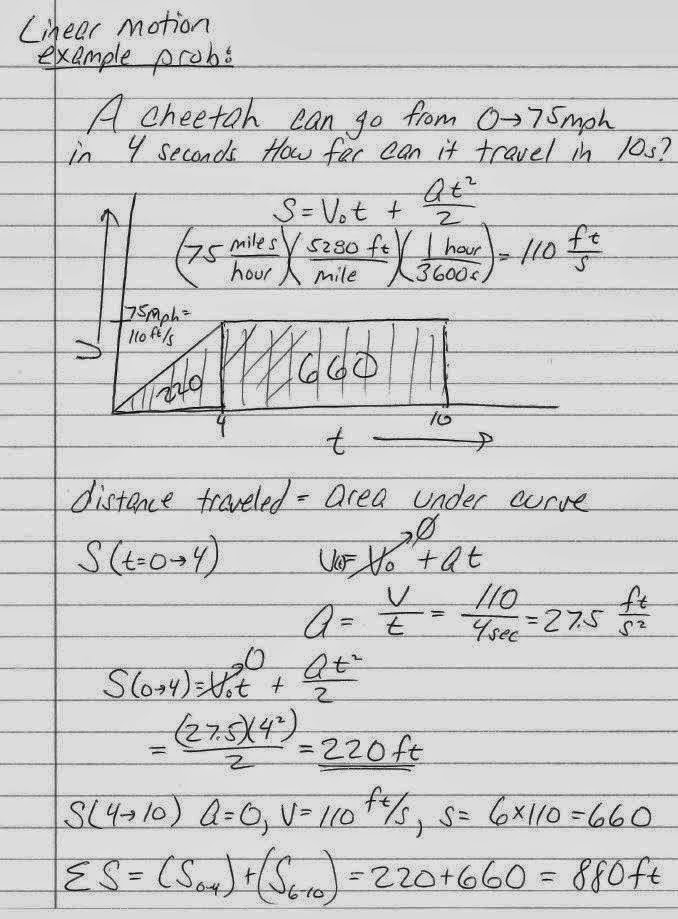
    Cheetah Example problem

    If you can get everything set up for the Cheetah problem, you can copy and paste this format for the mousetrap car data.

    I think most of you are becoming familiar with excel, but just in case... sorry, I should have gone through this at the beginning of the semester....


    Housekeeping:
    Double click on a sheet name, and rename it to better organize your working area:
    Here, I have renamed "Sheet 2" to "Cheetah", and "Sheet 3" to "Mousetrap Car"

    Use the (+) to add more sheets.

    Get in the habit of using multiple sheets for a project to better organize your work.


    #1 Set up your table

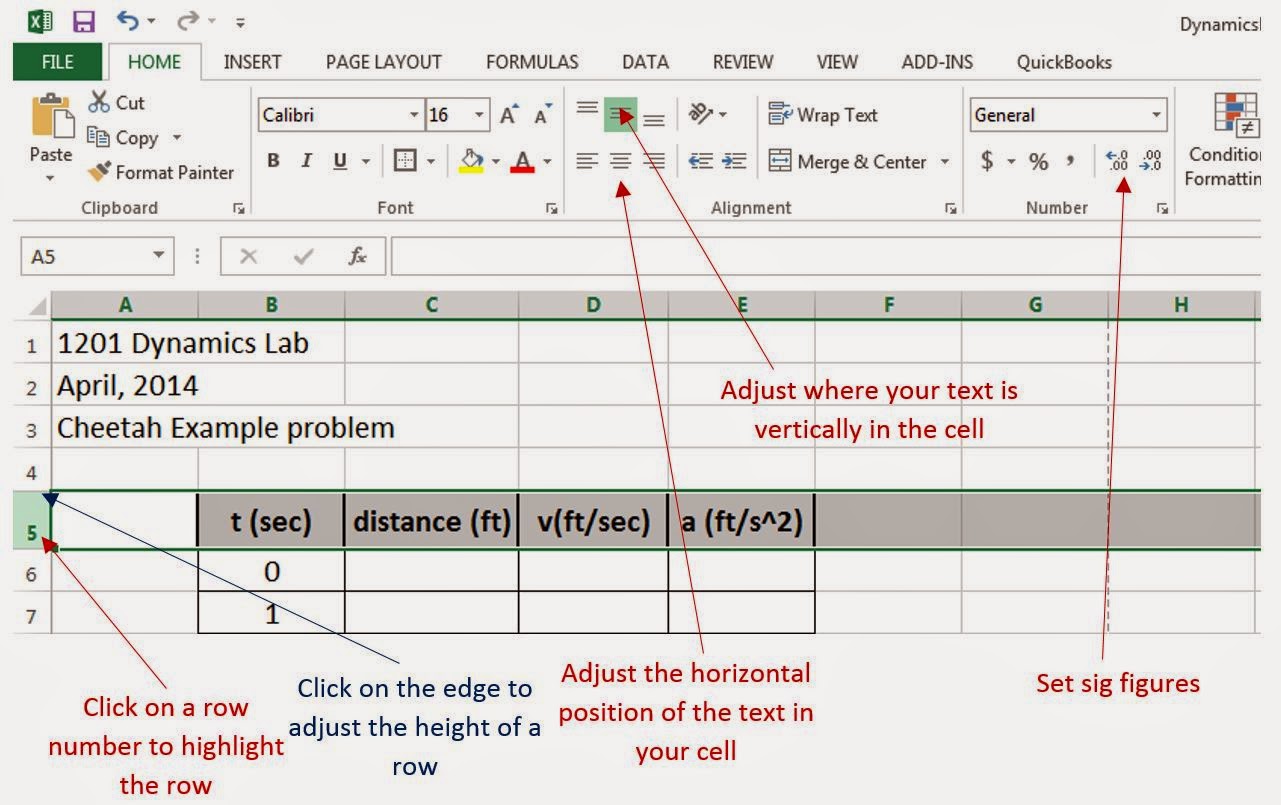
    Use big bold font for headings
    Add borders to cells, thick borders around Titles.
    Center your text in the cells.
    Set your precision (the number of decimals displayed) etc.

    Note:
    Just hover your mouse over the icons in the menu ribbon, wait for a second, and a little text box will appear with a description of the tool you are hovering over.

    Some icons have a little arrow next to them, click on the arrow to see all of the different options available.


    Test out some of the pre-made tables, but generally, you will want to make your own table  (the colors look nice on the screen, but make it hard to print)

    Don't forget to list the units you are using!


    Printing:
    I like to format everything for the printer right from the start (so I don't have to resize everything later).


    Resize columns and rows so you can easily see data, and so your table is centered on your page:

    Clicking on the upper left hand corner highlights all of your cells so you can format everything (like the font size, and precision) together:


    You can also select individual columns and rows to format:


    Same thing with columns, just click on a column (A, B, C) instead of a row.

    I like to change the cell color in the top of the table to light grey:


    Not that everything is formatted correctly, it's time to start entering equations!

    For the Cheetah problem:


    You don't need calculus to solve this, but know that this is one of the places calculus comes in handy if you have it!

    Think about the graphs & how they relate to one another.

    position vs. time → velocity = slope = ds/dt
    Velocity vs. time →position = vel * time = (mph*h = m) = area under curve.
    Velocity vs. time → acceleration = dV/dt = slope of V-t line
    Acceleration vs. time → adt = dv  (a = dv/dt)

    Simplify areas under curves to being just triangles and rectangles...


    Note: Often equations have constants in them that you want to define outside of the table.

    Make a new table for initial position, velocity, and acceleration.

    Rename the cells
    c6→so
    c7→vo
    c8→ao

    Just highlight the cell name, and type a new name into it.  When you are referencing this value in your equation, you can now use a variable name, instead of a cell name. 


    Type in your equations:
    Think of it just like typing something into your calculator.

    Just highlight a cell, start with "=" and tell it what you want to do.

    C11→0 Start with a distance of 0 (just type a zero in)
    C12 → after your first time step, is where your first distance calculation will be.  (how far has it gone in 1 second?)

    Notice the color coding to keep track of what cells are in your equ.


    Once you have an equation in one cell, you can copy it down to the other  cells - just select the cell you have, grab the green square in the lower right hand corner, and drag it down.

    Cells that you have renamed (like dt) will not change their value when you copy your equation down.

    If you did not rename your cell, but you want it to be the same, use dollar signs.

    $C$11 - will keep C11 through all calculations.
    $C11 will keep "C" the same, but 11 will change to 12, 13, 14 etc. as you copy it.

    Note the F4 key is the shortcut for adding dollar signs. 
    put your curser over the cell name in your equation
    Hit F4 once for two dollar signs ($C$11)
    Hit F4 again and again for other combinations ($C11, C$11, C11)


    What the copied equations look like:

    distance = (previous position) + 0.5 * acceleration * (time step)^2 + previous velocity * dt

    Velocities = 2*(change in distance/change in time)-previous velocity


    Look at the examples, calculate areas under curves, and make sure you understand how these equations relate to the graph!


    The previous position changes for each calculation:
    C11 = the previously calculated distance (so starting with 0, then going to the next time step etc.)

    C12
    C13
    C14

    Input equation for acceleration (a = dV/dt)
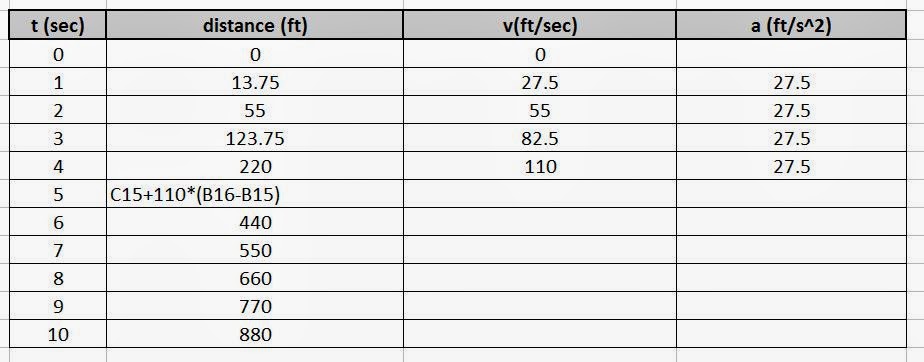
    You should not have the first 4 seconds of your graph filled out:


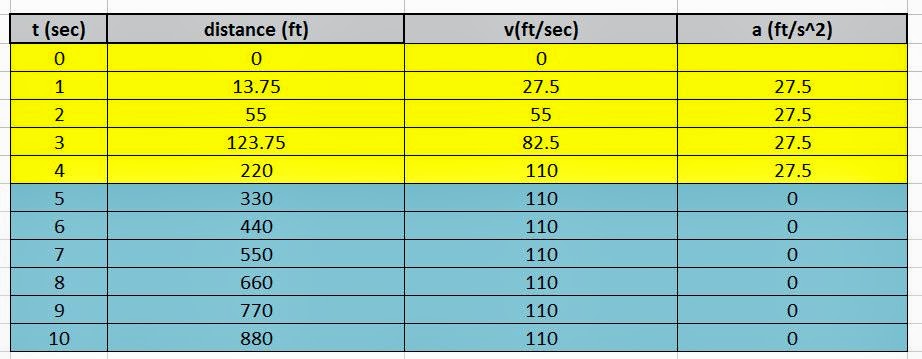
     In the Cheetah problem (and for your mousetrap cars) there are different equations for different parts of your graph.

    - has the acceleration changed? you might need a new equation! 

    Cheetah - after 4 sec, it stops accelerating, and instead maintains a constant speed of 110 ft/sec.

    For the distance calculations starting at t = 5sec, acceleration is 0, and velocity is constant 110, so new distance = old distance + Vdt

    If your new distance is calculated correctly, can you just copy down the same v and a equations?  try it out, think about it!

    Don't forget to save your work when you have all the equations in correctly! 

    Now to graph out your data:
    Highlight your entire table (including the titles t(sec), distance (ft), v(ft/sec), etc...

    Insert →Chart→Scatter (xy) chart

    Excel creates a default graph with 3 data sets (distance, velocity, and acceleration) all graphed against time.

    Let's make three separate graphs, instead of one graph.

    Copy the graph to make three graphs:
    select graph, Ctrl+C, then Ctrl+V to paste.

    Select and delete lines off of each graph so that you are left with only one line per graph:


    Now we need to get rid of the legends, and add axis labels
    x→time
    y→distance, vel, acceleration etc.

    Just select a graph, and click on the (+) to add axis titles.
    Click on the paintbrush too to see editing tools there!

    Label all of your graphs correctly:


    For your Mousetrap Car data, you will need to add a trend line to your graph. 

    Just select your line, right click on it, then select "add trendline"


    If you select the trendline, there is a menu to let you display the equation, select what kind of a fit, etc.


    When data is not perfect, it is better to calculate Vel and Acc off of a nice smooth trend line.  Engineers use trendlines a lot!

    Note,
    R-squared = the coefficient of determination (a measure of how well the model fits the data). Perfect fit → R-squared = 1.
    horrible fit →  R-squared = 0

    If you want, break your line up into two lines, one that is 0>t>4, and one for 4<t<10.  Fit two different lines.  times above 4 should fit perfectly to a linear line. 

    Note: Do you have a different version of Excel?
    Just youtube it to figure it out!!
    Youtube → search "How to create a graph in Excel 2009" etc.

    Think of it like driving cars - once you can drive a toyota, you can drive a honda too, the basic ideas in all of the versions are the same, you just have to find where they moved all of the buttons to. 

    Error Propagation test:
    Pretend that instead of calculating the distances in the cheetah problem, you measured them off a camera (like we are going to do with the mousetrap cars).  Copy your Cheetah data, and change the displacements so that they are all a little wrong, and see what happens to your velocity and acceleration calculations.

    What % does your velocity change by if your position is off by 5%?  What % does your acceleration change by?

    Artificially create both random (some higher, and some lower), and systematic errors (all distances larger, or smaller) errors, and see what this does to the rest of your calculations.

    Copy your cheetah data into a new worksheet.
    1. Insert a new column next to your old distance column
    2. Copy your correct distances into the new column (just type in the numbers, do not use an equation to put them in)
    3. Erase your old distance column (what V and a use to make calculations off of) and input an equation where the new column's distance is the old column + error.

      - Make a table to generate random errors.

     - to make a random number in excel type in = RAND() 
    Make a column of = RAND()
    Another column = first column * multiplication factor (like 5)
    Another column = insert 1 and -1's
    Another column = 1st * 1 or -1 to add errors randomly to either side of original data.


    You should notice that it doesn't take much error in your distance measurements to make your velocity and acceleration calculations go haywire!  This is an example of "error propagation" issues, and you will run into it over and over again when taking data. 

    Create a fit to your distance with errors line, use this equation to make a new smoothed out distance column, and try your V and a calculations again.