

18.2 Two major divisions of Dynamics:
1. kinematics
- study of motion without reference to the forces causing the motion
2. kinetics
- relates forces to motion

Newton's Laws of Motion:
1st law:
A body in motion tends to stay in motion.

A body at rest wants to stay at rest.

ie - things want to keep doing what they are doing, you have to apply a force if you want it to change what it is doing.
Inertia = the resistance of any physical object to any change in its motion
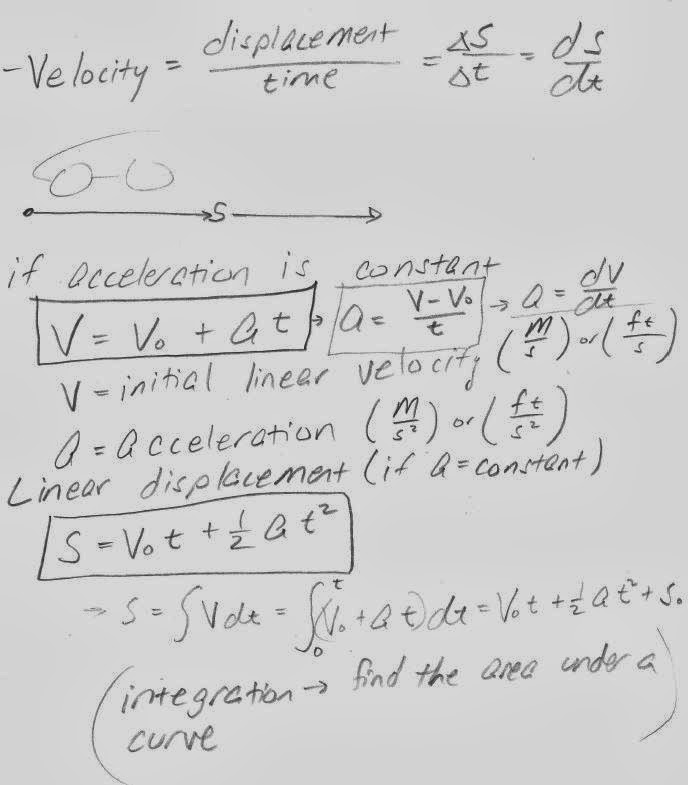
2nd law: Force = Mass * acceleration
The acceleration of a particle is proportional to the force acting on it and inversely proportional to the particle mass; the direction of acceleration is the same as the force direction.

Large m, Large F.... small F, small m
F = ma
 Constant acceleration
3rd law:
The forces of action and reaction between contracting bodies are equal in magnitude, opposite in direction, and colinear.


Law of gravitation:
The force of attraction between two bodies is proportional to the product of their masses and inversely proportional to the square of the distance between their centers.

Kinematics:
If position changes linearly with time...

If position changes non-linearly with time:


or -
x(t) = V.t + 0.5at^2
acceleration = change in velocity / change in time
a = 110/4 = 27.5 ft/s^2
x(0→4) = 0.5*a*t^2 = 0.5*27.5*4^2 = 220 ft
x(4→6) = V*t = 110*(10-4) = 660 ft
Try setting up an excel file that calculates distance, velocity, and acceleration.
Find the area under the curve between times "t1" and "t2".
Area = triangle + rectangle

V2 = 2*(x2-x1)/(t2-t1) - V1
a = (v2-v1)/(t2-t1)
If you only had the distance and time data below, could you figure out the velocity and acceleration?

velocity is increasing with time.

Constant Velocity, from t = 0 to 10 sec
Velocity = slope = dx/dt

Displacement for time = 0 to 10 sec

Velocity
Area under curve = (Velocity)*(time)
= (feet/sec) * (seconds)
= feet
= distance traveled

Acceleration
Area under curve = (feet/sec^2) * (sec)
= (feet/sec)
= change in velocity


Mousetrap Car!!!
Can you figure out what the position, velocity, and acceleration graphs look like for a mousetrap car?

Main idea behind mousetrap cars:
Skim through - link


If you want, you could use your acceleration data to calculate some forces (but I won't make you for this lab, we'll just worry about s,V,a)


*************************************
Lab:
Collect displacement vs. time data by videotaping your mousetrap car.
Calculate velocities and accelerations from your position vs. time data.
What you need to turn in:
Table and 3 Graphs of your data
1. Displacement vs. time
2. Velocity vs. time
3. Acceleration vs. time
Use an xy scatter plot, and label the x and y axes.
Videos link for Tu, MW link

Some example data sets:
|
|||||||||||||||||||||||||||||||||||||||||||||||||||||||||||||||||||||||||||||||||||||||||||||||||||||||||||||||||
tu:
|
|||||||||||||||||||||||||||||||||||||||||||||||||||||||||||||||||||||||||||||||||||||||||||||||||||||||||||||||||
The data isn't perfect, it's better to calculate everything from a fit to the line, instead of from the data itself: | |||||||||||||||||||||||||||||||||||||||||||||||||||||||||||||||||||||||||||||||||||||||||||||||||||||||||||||||||
|
|||||||||||||||||||||||||||||||||||||||||||||||||||||||||||||||||||||||||||||||||||||||||||||||||||||||||||||||||
| Use excel to find an equation to your line - right click on line on graph - add trendline - choose polynomial, display equation. |
|||||||||||||||||||||||||||||||||||||||||||||||||||||||||||||||||||||||||||||||||||||||||||||||||||||||||||||||||
   |
|||||||||||||||||||||||||||||||||||||||||||||||||||||||||||||||||||||||||||||||||||||||||||||||||||||||||||||||||
No comments:
Post a Comment