In the news, &
Engineering innovation
http://www.reshareable.tv/never-thought-a-billboard-could-be-used-this-way.html
Thought for the day:
A speaker gave everyone at a seminar a balloon, and told them to write their name on it. All the balloons were collected and put in another room, then everyone was asked to find their balloon. There were a lot of balloons, a lot of people, it was very hard for anyone to perform the task.
After some time of frustration, the speaker changed the task from finding your own balloon, to choosing a random balloon and finding the person whose name was written on it. Everyone just had to listen for their name being called out, within minutes everyone had their own balloon.
What is the moral of the experiment?

Projects -
Were you able to meet with your group over spring break? Have you started construction?
Team evaluation -
I'll email you comments from your team with your midterm grade.
Don't feel too bad when you hear your weaknesses - no one is perfect.
This is not a job, this is school - the point of school is to become better people.1st step in AA - admit the problem. Steps 2-12, fix the problems.
4 realities:
1. How you see yourself.
2. How others see you
3. How you think others see you.
Test:
Email me if you want another chance at it, and I'll leave a copy of a different test at the LSC testing center.
Chapter 10 - Computer Tools for Engineers &
Skim through chapter 10,
History of the Internet
Searching the Web:
List of TLD's
http://en.wikipedia.org/wiki/List_of_Internet_top-level_domains
Words of Warning:
Test: choose a random wiki page, and see how easy it is to edit it, but then see how long your edit lasts before someone else corrects it.
Test: If you have never created a blog before, try it out, create a blog for free on blogger.com, or wordpress etc. See how easy it is! A group blog could be a great place to combine, store, and share info for your team project!
10.3 Word processing Programs
10.4 Spreadsheets (Excel)
10.5 Mathematics Software
10.6 Presentation Software (Power Point) Learning new computer software:
As an engineer, and just as a person living in this century, you will constantly battle the need to learn new computer software.
Use online resources for learning software, and for learning everything.
Use youtubes, use wiki, use the program's website and help resources. Just open the program up, and play around on it until you get the hang of it.
Mathematica
One of the computational software programs used in many scientific, engineering, mathematical and computing fields.
One of the computational software programs used in many scientific, engineering, mathematical and computing fields.
Invented by Stephen Wolfram and is developed by Wolfram Research of Champaign, Illinois.
- Mathematica 1.0 (June 23, 1988)
- Mathematica 9.0.1 (January
30, 2013)
.
Stephen Wolfram -
Married with 4 kids, PhD from Cal Tech physics department, was a child of Jewish refugees. His work in physics led him to create a computer program that solved, first algebra problems, then more complex systems. Eventually, he left academia to create his own company (Wolfram).
He is the author of "A New Kind of Science", a book where he theorizes that the universe is digital in nature, and runs on fundamental laws which can be described as simple programs.
He has now expanded his program to answer, not just math problems, but all kinds of questions. His work is used by Bling, Google, Siri, and Yelp's search engines.
He has many youtubes, including the TED talk:
Features of Mathematica include:
- *Elementary mathematical function library*Matrix and data manipulation tools*2D and 3D graphing*Solvers for systems of equations*Numeric and symbolic tools for discrete and continuous calculus*Multivariate statistics libraries
How to type formulas in:
Vertical curser – type in existing section
Horizontal cursor – click to create a new cell
enter key – inserts new lines into cell
Shift+enter - computes results
(or “enter” on numeric keypad)
.
*** Mathematica "help" resources - Vertical curser – type in existing section
Horizontal cursor – click to create a new cell
enter key – inserts new lines into cell
Shift+enter - computes results
(or “enter” on numeric keypad)
.
help - documentation center- 10,000 pages of info on all the functions with examples and tutorials on how to use them
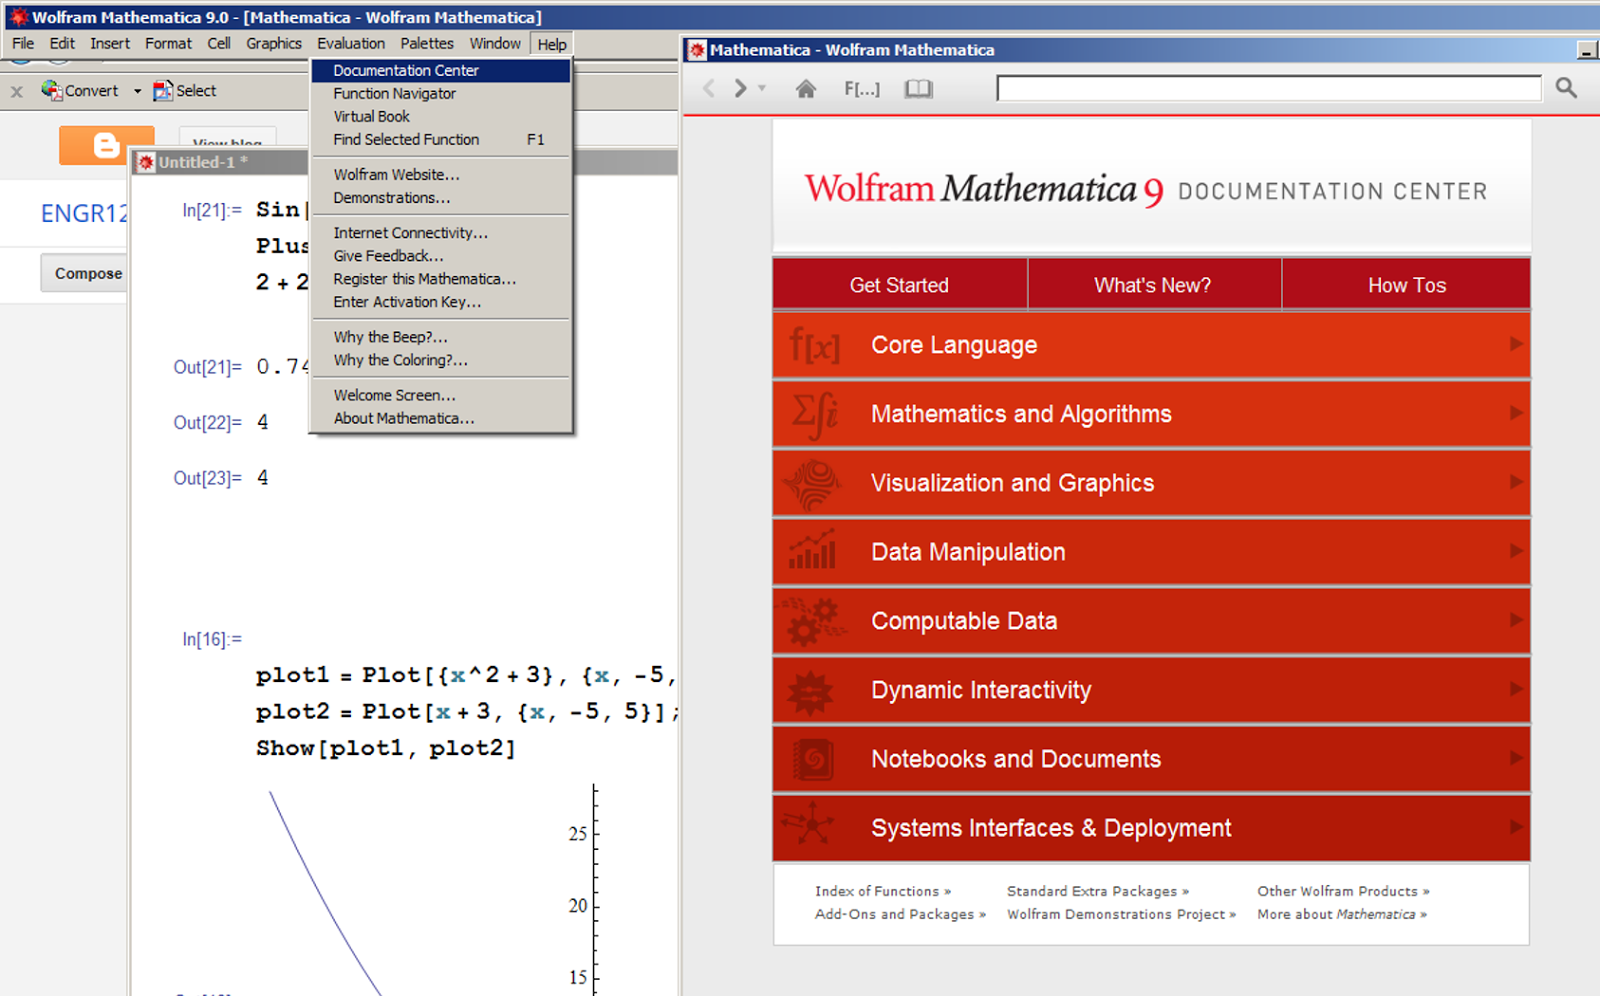
Check out:
*Visualizations and Graphics,
*Mathematics and Algorithms,
*Data Manipulation
Just type something in, cut and paste the examples out of the help - modify examples to do what you need to do.

help - Virtual book
Highlight function - help (or F1) - find selected function
type "?" followed by what you want help with:
?Plot - bring up Plot examples
?Plot* - everything that starts with plot
Plo... - edit, complete selection (ctrl - K)
Edit - make template - (Ctrl + Shift + K) - fill in basic structure of a function.


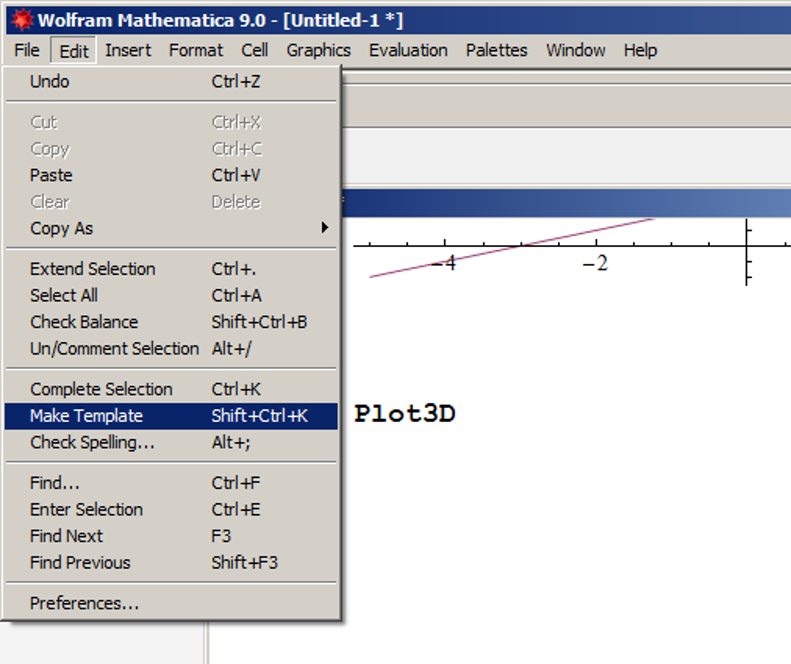
Fill in the values you need.


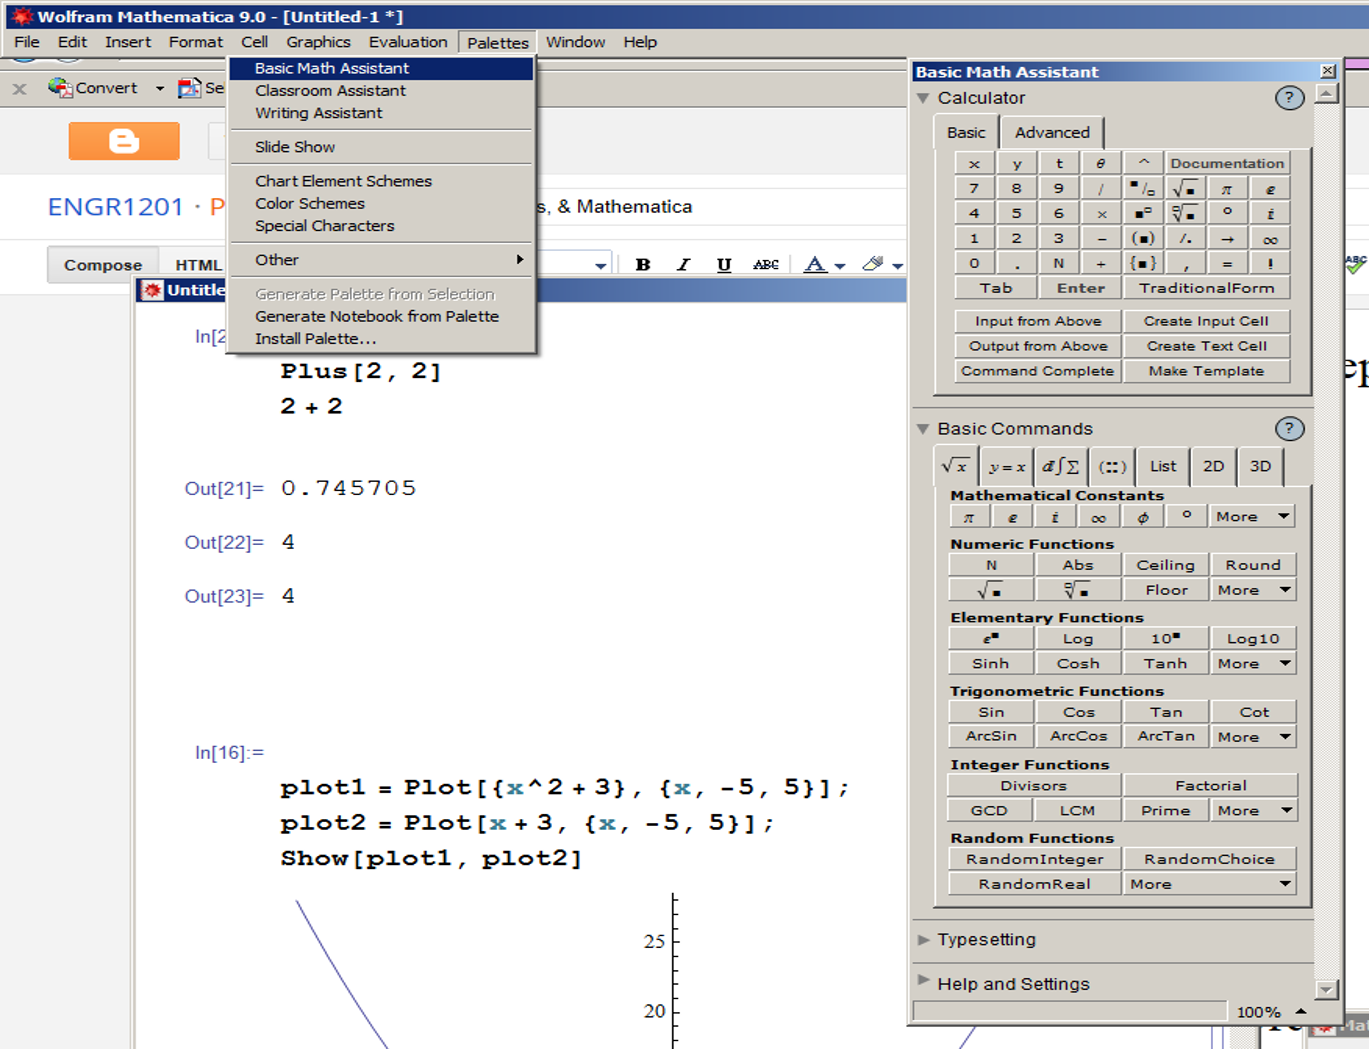
Pallets: Use to input formulas,
Start with the "Basic Math" pallet.

Function[square bracket, arguments separated with commas]
Plus[2,2] = 2+2

List and Matrix operations:
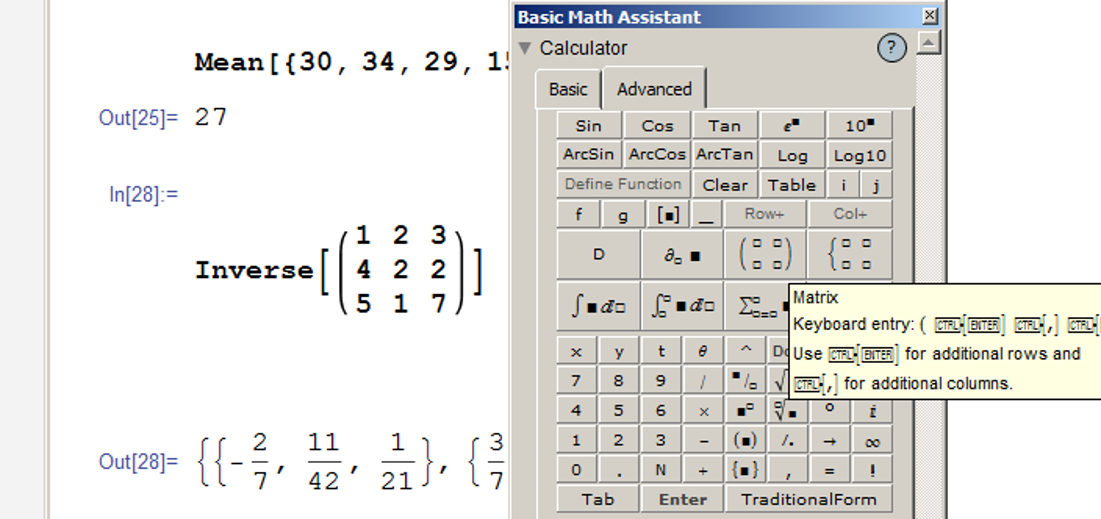
Mean[{30, 34, 29, 15}]
Inverse of 3 by 3 matrix:
Inverse[{{1st row}, {2nd row}, {3rd row}}]
Determinant:
Det[{{1, 2, 3, 4}, {5, 6, 7, 8}, {1, 7, 4, 3}, {1, 2, 3, 5}}]

m = {{1, 2, 3, 4}, {5, 6, 7, 8}, {1, 7, 4, 3}, {1, 2, 3, 5}}
m.m.m

Solve:
use "==" - two equal symbols
{{x-2}, {x-3}}
Solve[x^2+x+1==0, x]//N
//N - gives answer in numerical form
{{x-.5-.86i},{x-.5+.86i}}
Solve[a*x^2 + b*x + c==0, x]
x = quadratic formula
Solve system of equations - use {}
Solve[{3 x + 2 y ==15, 3*x - 3*y == 12}, {x, y}]//N

Numerical solution
(for problems you can't solve with algebra)
FindRoot[Log[x]==Exp[x]-5, {x,3}]
{x,3} 3 = num you start guessing with, it will find the solution closest to 3.
Plot[{Log[x], Exp[x]-5}, {x, 0, 2.5}]
intersection of two lines = solution
note - ln(x) = Log[x]

Solve[Sin[x]==.5, x]
- gives an infinite # of solutions:
Reduce[Sin[x]==.5,x]
Plot[{Sin[x], .5}, {x, 0, 6*Pi}]

Graphing:
Points:
ListLinePlot[{{1,2}, {3, 4}, {5,3}}]


Plot[Sin[x]/x , {x, -9.4, 9.4}]
Plot3D[Sin[x*y], {x, -Sqrt[3*Pi], Sqrt[3*Pi]}, {y, -Sqrt[3*Pi], Sqrt[3*Pi]}]
to rotate graph with mouse – just click on it with mouse
(Shift) + (move mouse) to pan around
(Ctrl) + (mouse) to zoom in and out.

ContourPlot[Sin[2*x*y], {x, -Sqrt[3*Pi], Sqrt[3*Pi]}, {y, -Sqrt[3*Pi], Sqrt[3*Pi]}]
Plot[Tooltip[{Sin[x], Sin[x]/x}], {x, -8, 8}]
Multiple plots on the same axis:
Plot[{Sin[x], Sin[x]/x}, {x, -8, 8}]
plot1=Plot[x^2+3,{x,-5,5}];
plot2=Plot[x+3, {x,-5,5}];
(; suppresses output)
Show[plot1, plot2]

Click on graph, then customize it with menu below it, or see everything you can do to it through:
Options[Plot]
Table[Plot[Sin[x]/x, {x, 0, 2 Pi}, Filling -> Top]]
AxesLabel→{“x”, “y”, “z”},
Mesh→None,
ColorFunction→Function[{x, y, z}, Hue[x x y]],
ImageSize→600
Plotrange→{{-0.25, 1.25}, {-0.25, 1.25},
PlotStyle→{{Dashing[0.5}, Black}, Black},
AspectRatio→Automatic,
Filling→{1→Bottom, 2→Top},
FillingStyle→{1→Directive[{Red, Opacity[0.5]}], 2→Directive[{Yellow, Opacity[0.5]}]}]
Frame→True,
Axes→true,
LabelStyle→{FontFamily→”Arial”, FontSize→24},
FrameLabel→{Time (s)”, “Displacement (cm)”},
PlotStyle→{Red, Thickness[0.01]}
Click and drag to make larger or smaller
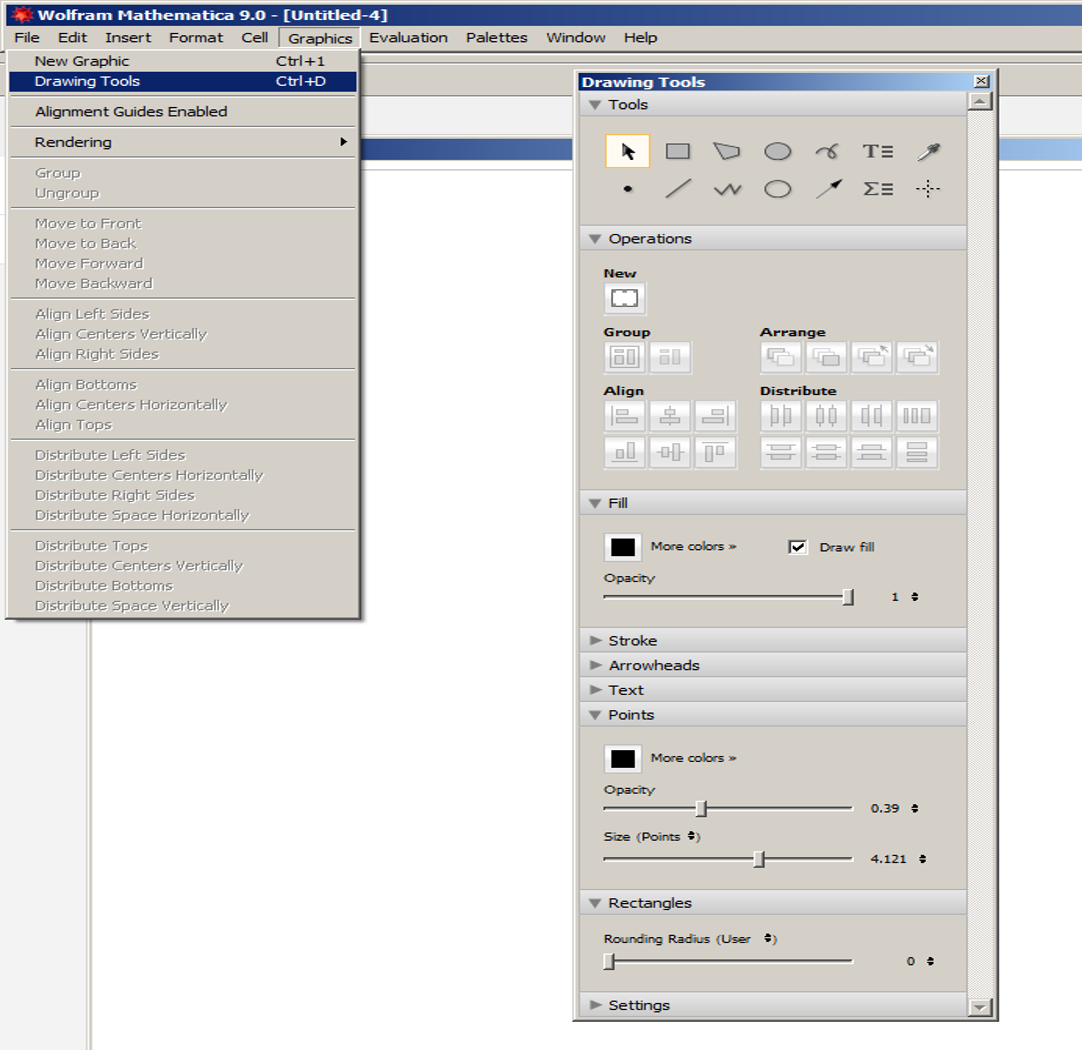
graphics – drawing tools – draw on arrow, text boxes, etc.
double click on curve to move it around, etc.
ListPlot

Plot a function:

Chapter 17 - Math Review
Skim through chapter 17 for some example math problems to play around with. Use the Mathematica help center to search for tools that help you tackle some of the different problems from chapt 17. ******************************************************************************
ENGR1201 Mathematica Lab
Names:___________
1. (_____12 points) Look up 4 different functions in the help documentation center, copy and paste the function examples into a Mathematica file, execute them, and provide one sentence explaining what each function did.
Names:___________
1. (_____12 points) Look up 4 different functions in the help documentation center, copy and paste the function examples into a Mathematica file, execute them, and provide one sentence explaining what each function did.
2. (_____6 points) Create
a 3 by 3 matrix, and perform an operation on it.
3.(____ 12 points)
a) Make a 2D graph of the following (x,y)
pairs: (1,1), (2,4), (3,9), (4,16),
(5,25).
b) Choose
3 editing tools out of Options[Plot] or menu below the graph to change the appearance of your graph.
c) Use “graphics”
– “Drawing tools” to add arrows and text to your graph.
4. (_____8 points) Solve this system of linear equations
a) using the Solve[...] command, and
b.) by graphing both equations on a single plot and finding the intersection:
2x+y = 9, 3x-y = 16
5. (____/ 12 points) Solve one of the example problems from chapter 17 in your book using Mathematica. Write the page # and example #that you choose.
6. (Extra Credit)
Make a 3D graph from an equation of your choice, print your graph, bring it to the front and tape it on the board, +5 points extra credit on test for the (class-voted) best 3D graph.
******************************************************************************
New features:
http://www.wolfram.com/mathematica/new-in-9/advanced-hybrid-and-differential-algebraic-equations/double-pendulum.html
Fractals:
http://www.bugman123.com/Fractals/
Certification:
http://www.wolfram.com/training/certification/students/
No comments:
Post a Comment